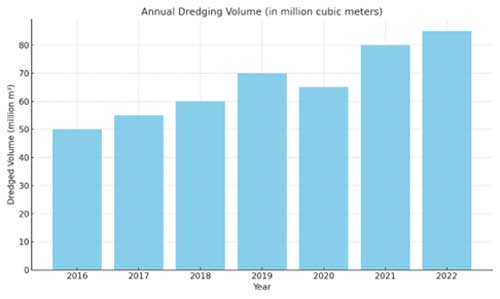
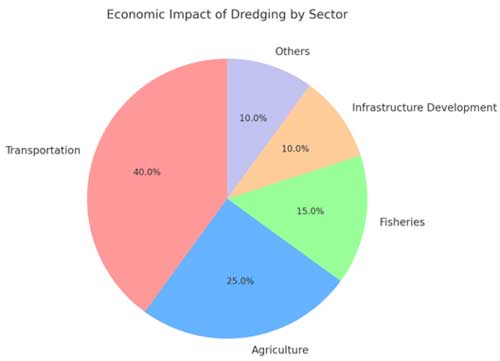
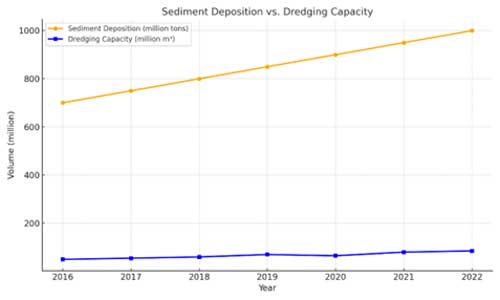
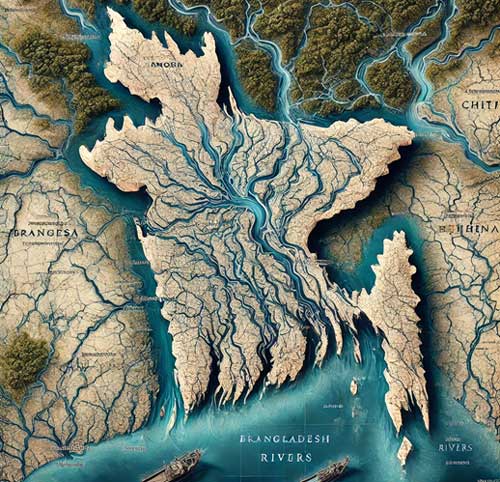
DATA VISUALIZATION ANNUAL DREDGING VOLUME A bar chart showing the annual volume of sediment dredged from major rivers like the Padma, Jamuna, and Meghna. ECONOMIC IMPACT OF DREDGING A pie chart depicting the sectors that benefit from dredging, including transportation, agriculture, and fisheries. SEDIMENT DEPOSITION vs. DREDGING CAPACITY A line graph comparing annual sediment deposition rates in major rivers with the total dredging capacity of BCSDOA members. BANGLADESH RIVER SYSTEM MAP A detailed map illustrating the major river systems and the regions where dredging activities are concentrated.